


In a rapidly changing world, the ability to anticipate future trends is an invaluable asset. Forecasting, the process of making predictions about future outcomes based on historical data, plays a pivotal role in a multitude of sectors, including finance, sales, marketing, and supply chain management, among others. From predicting stock prices to determining future product demand, accurate forecasting can guide strategic planning, optimize operational efficiency, and give organizations a competitive edge.
Table of Contents
Yet, the art and science of forecasting can often seem complex and intimidating, especially to those new to the field. However, what if we could leverage commonly used software to simplify and demystify this process? Enter Microsoft Excel, a software widely recognized for its robust data management and analytical capabilities. Among its suite of powerful features, Excel offers the ‘Forecast Sheet’, a user-friendly tool designed to generate visual and statistical forecasts based on historical data.

In this article, we’ll uncover the mechanics of the Excel Forecast Sheet, demonstrating how it uses sophisticated statistical techniques to predict future trends. By understanding and effectively using this tool, you can start harnessing the power of forecasting in your own work, supporting informed decision-making and strategic planning. So, whether you’re a seasoned analyst or a beginner stepping into the world of data analysis, join us as we explore the exciting realm of forecasting with Excel.
Understanding the Excel Forecast Sheet
Microsoft Excel is renowned for its myriad of features that streamline data analysis and management. One such feature is the Forecast Sheet tool, a powerful function that enables users to extrapolate and visualize future trends based on historical data.
So, how does the Excel Forecast Sheet work? At its core, the tool leverages a statistical technique called Exponential Smoothing (ETS). This algorithm extrapolates future trends by assigning weights to historical data, where recent data points are usually given more weight than older ones. ETS is particularly adept at identifying and accounting for data trends and seasonality, enabling more accurate predictions.
To generate a forecast, you provide the tool with a series of date-time entries alongside corresponding values. For example, you might input a list of dates and their respective sales figures. Excel then analyzes these data, creating a predictive model based on the observed trends and patterns.
Upon executing the forecast function, Excel presents you with a new worksheet. This contains a forecast chart and a table illustrating your historical data along with the projected data. Importantly, the forecast also includes a ‘confidence interval’ – a statistical range indicating the reliability of the forecast. In essence, the wider this interval, the greater the uncertainty.

In the following sections, we’ll delve deeper into how to prepare data for forecasting, create a Forecast Sheet, interpret the results, and understand its limitations. Whether you’re planning for business growth, conducting academic research, or analyzing personal finance trends, the Excel Forecast Sheet can be a game-changer in your data-driven decision-making process.
Preparing Data for Forecasting
The accuracy of forecasting largely depends on the quality of the input data. To effectively use Excel’s Forecast Sheet, it’s crucial to prepare and format your data correctly. Here’s what you need to know about this preliminary stage of the forecasting process:
Excel’s Forecast Sheet works best with time-series data. Time-series data is a sequence of numerical values recorded at regular intervals over a period. This could be anything from daily temperatures, monthly sales figures, yearly population growth rates, and so on. To use the Forecast Sheet effectively, ensure your data is chronological and that there are no significant gaps in the time series.
Accuracy in forecasting is highly dependent on the quality of your historical data. Data should be as clean and accurate as possible to improve the reliability of the forecasts. Outliers, or values that significantly deviate from the trend, can potentially skew the forecast. Similarly, missing values can introduce inaccuracies. If your data contains outliers or missing values, consider appropriate statistical methods to address these issues before running a forecast.
The amount of data you have can also influence the accuracy of your forecast. A larger dataset can often yield more reliable forecasts as it provides more information for the algorithm to learn from. It’s generally recommended to have at least a few dozen data points, but more complex patterns or seasonality might require years of data.
Once you’ve verified the suitability, quality, and adequacy of your data, it’s time to organize it in Excel. The forecasting tool requires at least two columns or rows of data: one for the date-time series (in ascending order) and another for the corresponding values. Excel accepts a variety of date-time formats, but it’s good practice to maintain consistency in your dataset.
Remember, garbage in, garbage out – this phrase perfectly encapsulates the importance of data preparation for forecasting. By ensuring your data is suitable, clean, accurate, and well-organized, you’re setting the stage for more effective and reliable forecasts. As we move on to creating a Forecast Sheet in the next section, keep these data preparation principles in mind.
Steps to Create a Forecast Sheet
Now that your data is prepared, you’re ready to generate your first forecast in Excel. Follow these step-by-step instructions to create a Forecast Sheet:
- Select Your Data – The First step is to select your data. Click and drag to highlight the columns or rows containing your date-time series and the corresponding values. Make sure your data-time series is in chronological order, and there are no missing values.
- Lunch the Forecast Sheet Tool – Go to the Data tab on Excel’s Ribbon (the menu at the top of the Excel window). Look for the “Forecast Sheet button in the Forecast group and click on it.
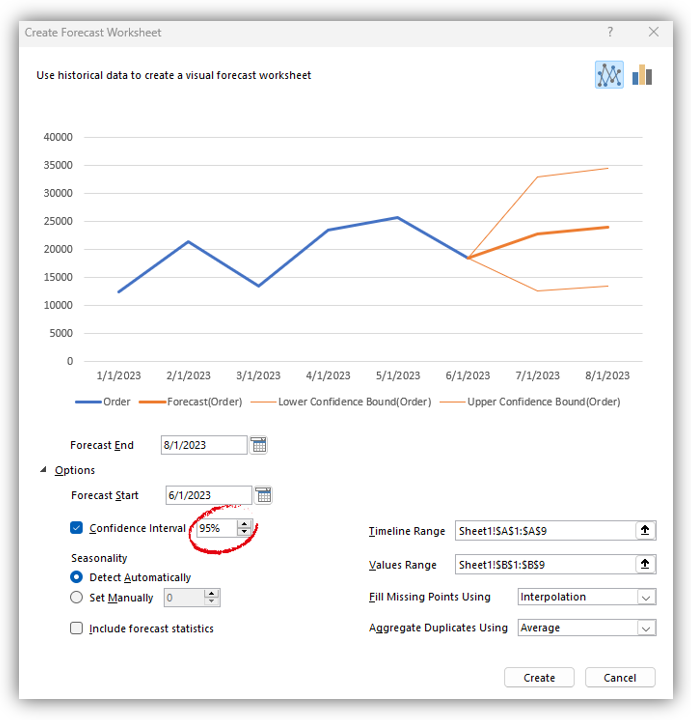
- Customize Your Foceast – A dialog box titled “Create Forecast Worksheet will appear. Here you can adjust the parameters of your forecast. By default, Excel will create a line chart and place the forecast end date approximately one period ahead of your last data point (for example, one month ahead in a monthly data series). However, you can change the forest end date to suit your needs. In the “Options” section, you can tweak advanced settings like the confidence interval, seasonality detection, and more. If you are unsure about these, you can leave them at their default settings.
- Create the Forecast Sheet – Once you’re satisfied with your settings, click “Create”. Excel will generate a new worksheet that includes a table of your historical and predicted values, along with a line chart to visually represent this data.
You have created your first Forecast Sheet in Excel. While this might seem straightforward, the real skill lies in interpreting the results and understanding what they mean for your forecasting objectives. In the next section, we’ll guide you through how to interpret the output from the Excel Forecast Sheet, helping you make sense of the results.
Interpreting the Forecast
Creating a forecast is just the beginning – the real value lies in accurately interpreting the results. Understanding the data presented by the Excel Forecast Sheet is crucial to making informed decisions. Here’s how to break down the output:
Understanding the Forecast Data
Upon generating a forecast, Excel provides a line chart and a corresponding data table. The line chart displays your original (historical) data alongside the forecasted data, visually distinguishing between the two.
The table contains date-time entries and corresponding values for both historical and predicted data. You’ll notice that the forecasted values extend beyond the last date of your original data, as per the parameters you set when creating the Forecast Sheet.
Confidence Intervals and Forecast Boundaries
Along with forecasted values, Excel also provides ‘Lower Bound’ and ‘Upper Bound’ values. These bounds constitute the ‘confidence interval’ of your forecast, which is crucial for understanding the range within which the actual future values are likely to fall. A narrower confidence interval suggests a more reliable forecast, while a wider interval suggests greater uncertainty.
For example, if you’re forecasting sales, and for a certain future month, the forecasted sales are 200 units with a lower bound of 180 and an upper bound of 220, it implies that, based on your historical data and the ETS algorithm, Excel expects the actual sales to fall within this range, 95% of the time (given a default confidence level of 95%).
Analyzing Trends from the Forecast Chart
Visually inspecting the forecast chart can help you identify trends and patterns in the forecast. Is the trend line rising, falling, or remaining steady? Are there any visible cycles or patterns? This visual analysis can supplement the numerical data and provide an intuitive understanding of the forecast.
Remember, forecasting is a blend of science and art, and the Excel Forecast Sheet is a tool to aid you, not to replace critical thinking and business intuition. In the next section, we will address some limitations of the Excel Forecast Sheet to help you interpret and apply your forecasts effectively.
Limitations of Excel Forecast Sheet
While the Excel Forecast Sheet is a powerful tool for making predictions based on historical data, it’s essential to understand its limitations. Awareness of these constraints will help you make more informed and reliable forecasts.
- Accuracy of Forecasts – Firstly, the old saying “past performance is not indicative of future results” rings particularly true in forecasting. The Forecast Sheet operates under the assumption that historical patterns will continue into the future. However, this might not always be the case, especially in volatile environments or situations where external factors can significantly influence the data.
- Limitations Related to Data Quality and Type – The quality and type of your data can greatly influence the accuracy of your forecast. As mentioned earlier, Excel’s Forecast Sheet works best with time-series data. If your data is not chronologically ordered or contains significant gaps, the tool might produce inaccurate results.
- Understanding the Assumption of Continued Trends – The Forecast Sheet is not designed to predict sudden, unexpected changes or ‘black swan’ events. Its predictions are based on the continuation of past trends and seasonal patterns. Therefore, it might not provide accurate forecasts for data that is likely to be impacted by future events not reflected in the historical data.
- Lack of Domain-Specific Forecasting Models – Excel’s Forecast Sheet uses a general-purpose ETS algorithm, which may not be suitable for all types of data or specific industries. Certain domains may require specialized forecasting methods not available in Excel.
Despite these limitations, the Excel Forecast Sheet remains a valuable tool for making informed predictions. In the final section, we will provide some best practices for using this feature to improve the reliability and usefulness of your forecasts.
Best Practices for Using Excel Forecast Sheet
While the Excel Forecast Sheet is a powerful tool, its effectiveness depends on how you use it. Here are some best practices to ensure you get the most out of your forecasting efforts:
- Ensure Data Quality – As we’ve mentioned previously, the quality of your input data directly influences your forecast’s accuracy. Spend time cleaning, organizing, and preparing your data before creating a forecast. Handle outliers appropriately, fill missing values logically, and ensure the chronological order of your time-series data.
- Regularly Update Forecasts – Forecasts should not be a one-time effort. As you get more recent data, update your forecasts to reflect these new insights. Regularly updating your forecasts helps keep them relevant and can improve their accuracy over time.
- Use Forecasts as Part of a Larger Decision-Making Process – Remember, forecasts are predictions, not certainties. They should be used as a part of a larger decision-making process, not as the sole basis for action. Always consider other factors, like market conditions, competitive analysis, and expert opinion, when making decisions based on forecasts.
- Understand the Confidence Interval – Be sure to consider the confidence interval when interpreting your forecasts. A wider confidence interval indicates greater uncertainty, which should be factored into your decision-making process.
- Experiment with Different Forecast Settings – Don’t hesitate to experiment with different settings in the Forecast Sheet tool. Adjusting the forecast start and end dates, changing the confidence level, and trying different options for seasonality detection can all influence the results and might offer more accurate or insightful forecasts for your specific data.
By following these best practices, you can harness the power of the Excel Forecast Sheet and make more effective, data-driven decisions. Whether you’re predicting sales, planning resources, or analyzing trends, Excel’s Forecast Sheet is a valuable tool in your data analysis toolkit.
Conclusion
In an ever-evolving world, being able to accurately anticipate future trends and outcomes is a significant advantage. Microsoft Excel’s Forecast Sheet function is a powerful and accessible tool that can assist businesses, researchers, and individuals alike in making informed, data-driven decisions.
Through our exploration of Excel’s Forecast Sheet, we’ve discovered how to prepare data, create forecasts, interpret results, understand the tool’s limitations, and apply best practices for effective forecasting. The Forecast Sheet tool, powered by the Exponential Smoothing (ETS) algorithm, turns historical data into a visual and statistical prediction of future trends, providing valuable insights for planning and strategy.
However, while this tool can greatly simplify the forecasting process, it’s vital to remember that these forecasts are ultimately based on past trends and data. As such, they should form part of a wider decision-making process, combined with other forms of analysis and intuition.
As with any tool, practice makes perfect. Therefore, continue to experiment with the Forecast Sheet, familiarize yourself with its various settings, and use it regularly to hone your forecasting skills. The more comfortable you become with this tool, the more effectively you can harness its potential.
In conclusion, with the Excel Forecast Sheet at your disposal, you’re well-equipped to navigate the uncertain waters of the future, using data from the past as your guiding star.
You can read some additional tips and more explanations on the Microsoft official site here.
If you are interested in another advanced AI Excel Feature, you can read this article about Linked Data Types.
FAQ for Excel Forecast Sheet Function
What is the Excel Forecast Sheet function?
The Excel Forecast Sheet function is a built-in tool that allows users to create a predictive model based on existing data. It can be used to forecast future data trends such as sales numbers, inventory requirements, or scientific data.
What kind of data is needed to use the Excel Forecast Sheet function?
To use the Forecast Sheet function, you need a series of time-based data (like dates or periods) and corresponding values (like sales or inventory levels).
How does the Forecast Sheet function work?
The Forecast Sheet function uses a method called Exponential Smoothing, which analyzes historical trends and seasonal patterns in the data to predict future values.
Can I customize the parameters of the forecast?
Yes, when creating a Forecast Sheet, Excel allows you to customize certain parameters, such as the end date of the forecast and whether to include a confidence interval.
How accurate are the predictions from the Excel Forecast Sheet function?
The predictions are based on past data and statistical analysis, so while they can provide a good estimate of future trends, they’re not 100% accurate. Unforeseen future changes or events can affect actual outcomes. Always use the forecasts as a guide rather than a definitive prediction.
Can I use the Excel Forecast Sheet function for non-business data?
Absolutely! While the Forecast Sheet function is often used for business purposes like sales or inventory forecasting, it can also be used for any time-series data. Examples include weather patterns, scientific data, and even personal finance trends.
How do I interpret the confidence interval in the forecast?
A confidence interval gives an estimated range of values which is likely to include an unknown population parameter. If Excel provides a 95% confidence interval for a forecasted value, it means that in 95% of the scenarios, the actual value will fall within this range. It provides a measure of uncertainty around the forecasted values.
Is there any cost associated with using the Excel Forecast Sheet function?
The Forecast Sheet function is included with your Microsoft Excel software and does not come with any additional cost.


Comments 1