


From May 12 onwards, OpenAI has provided ChatGPT Plus subscribers with a range of third-party plugins. A new plugin has been added to the system almost every day, serving diverse purposes. As there are now numerous plugins available, we aim to bring some order to the selection by presenting each plugin by category in a series of articles. At this time, we are looking for suitable tools to improve the efficiency of administrative tasks; in summary, these are ChatGPT Productivity Plugins.
The Show Me Diagram plugin is a helpful tool that allows users to create visualizations, such as diagrams or mind maps, based on their input. It’s especially useful for simplifying complicated concepts, processes, or systems through visual aids. The plugin utilizes ChatGPT LLM to convert free text chart descriptions into a Mermaid syntax, which is then sent to Mermaid through an API and displayed as a diagram within the chat.
How does it work
- User Prompt: The user asks to visualize a certain concept, process, or dataset. For example: “Draw me a mindmap for employee engagement” – check out the response here, or “Create a pie chart for this dataset: …” – check out the response here.
- Diagram Creation: Based on the user’s request, a diagram is created using a specific syntax. This diagram is designed to visually represent information the user asked about.
- Diagram Rendering: The diagram is then passed to the Show Me plugin API, which renders the diagram into a visual format.
- Diagram Presentation: The rendered diagram is then presented to the user. The user can ask follow-up questions about the diagram or request modifications. Thank the capabilities of ChatGPT, in addition to showing the individual elements on a graph, it also provides an explanation for them in text form.
Apart from these options, there is also a direct link to access the Mermaid online Flow Chart tool, which allows for direct editing of the completed graph. However, it is important to note that prior experience with the tool may be necessary, as it is not a user-friendly drag-and-drop application.
Conclusion
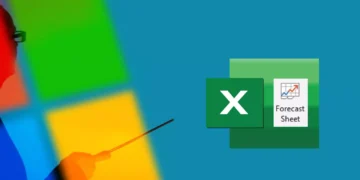
If you’re looking for a tool to create flow charts and mindmaps for brainstorming and organizing information, I highly recommend this tool. However, if your goal is to visualize data, a simple Excel chart would be a quicker and easier option. While Mermaid Chart can be used to visualize pie charts, it’s not suitable for creating bar charts.
OpenAI development